monitoring
Monitor Letta Cloud agent performance, usage, and health metrics.
Monitor your agents across four key dashboards:
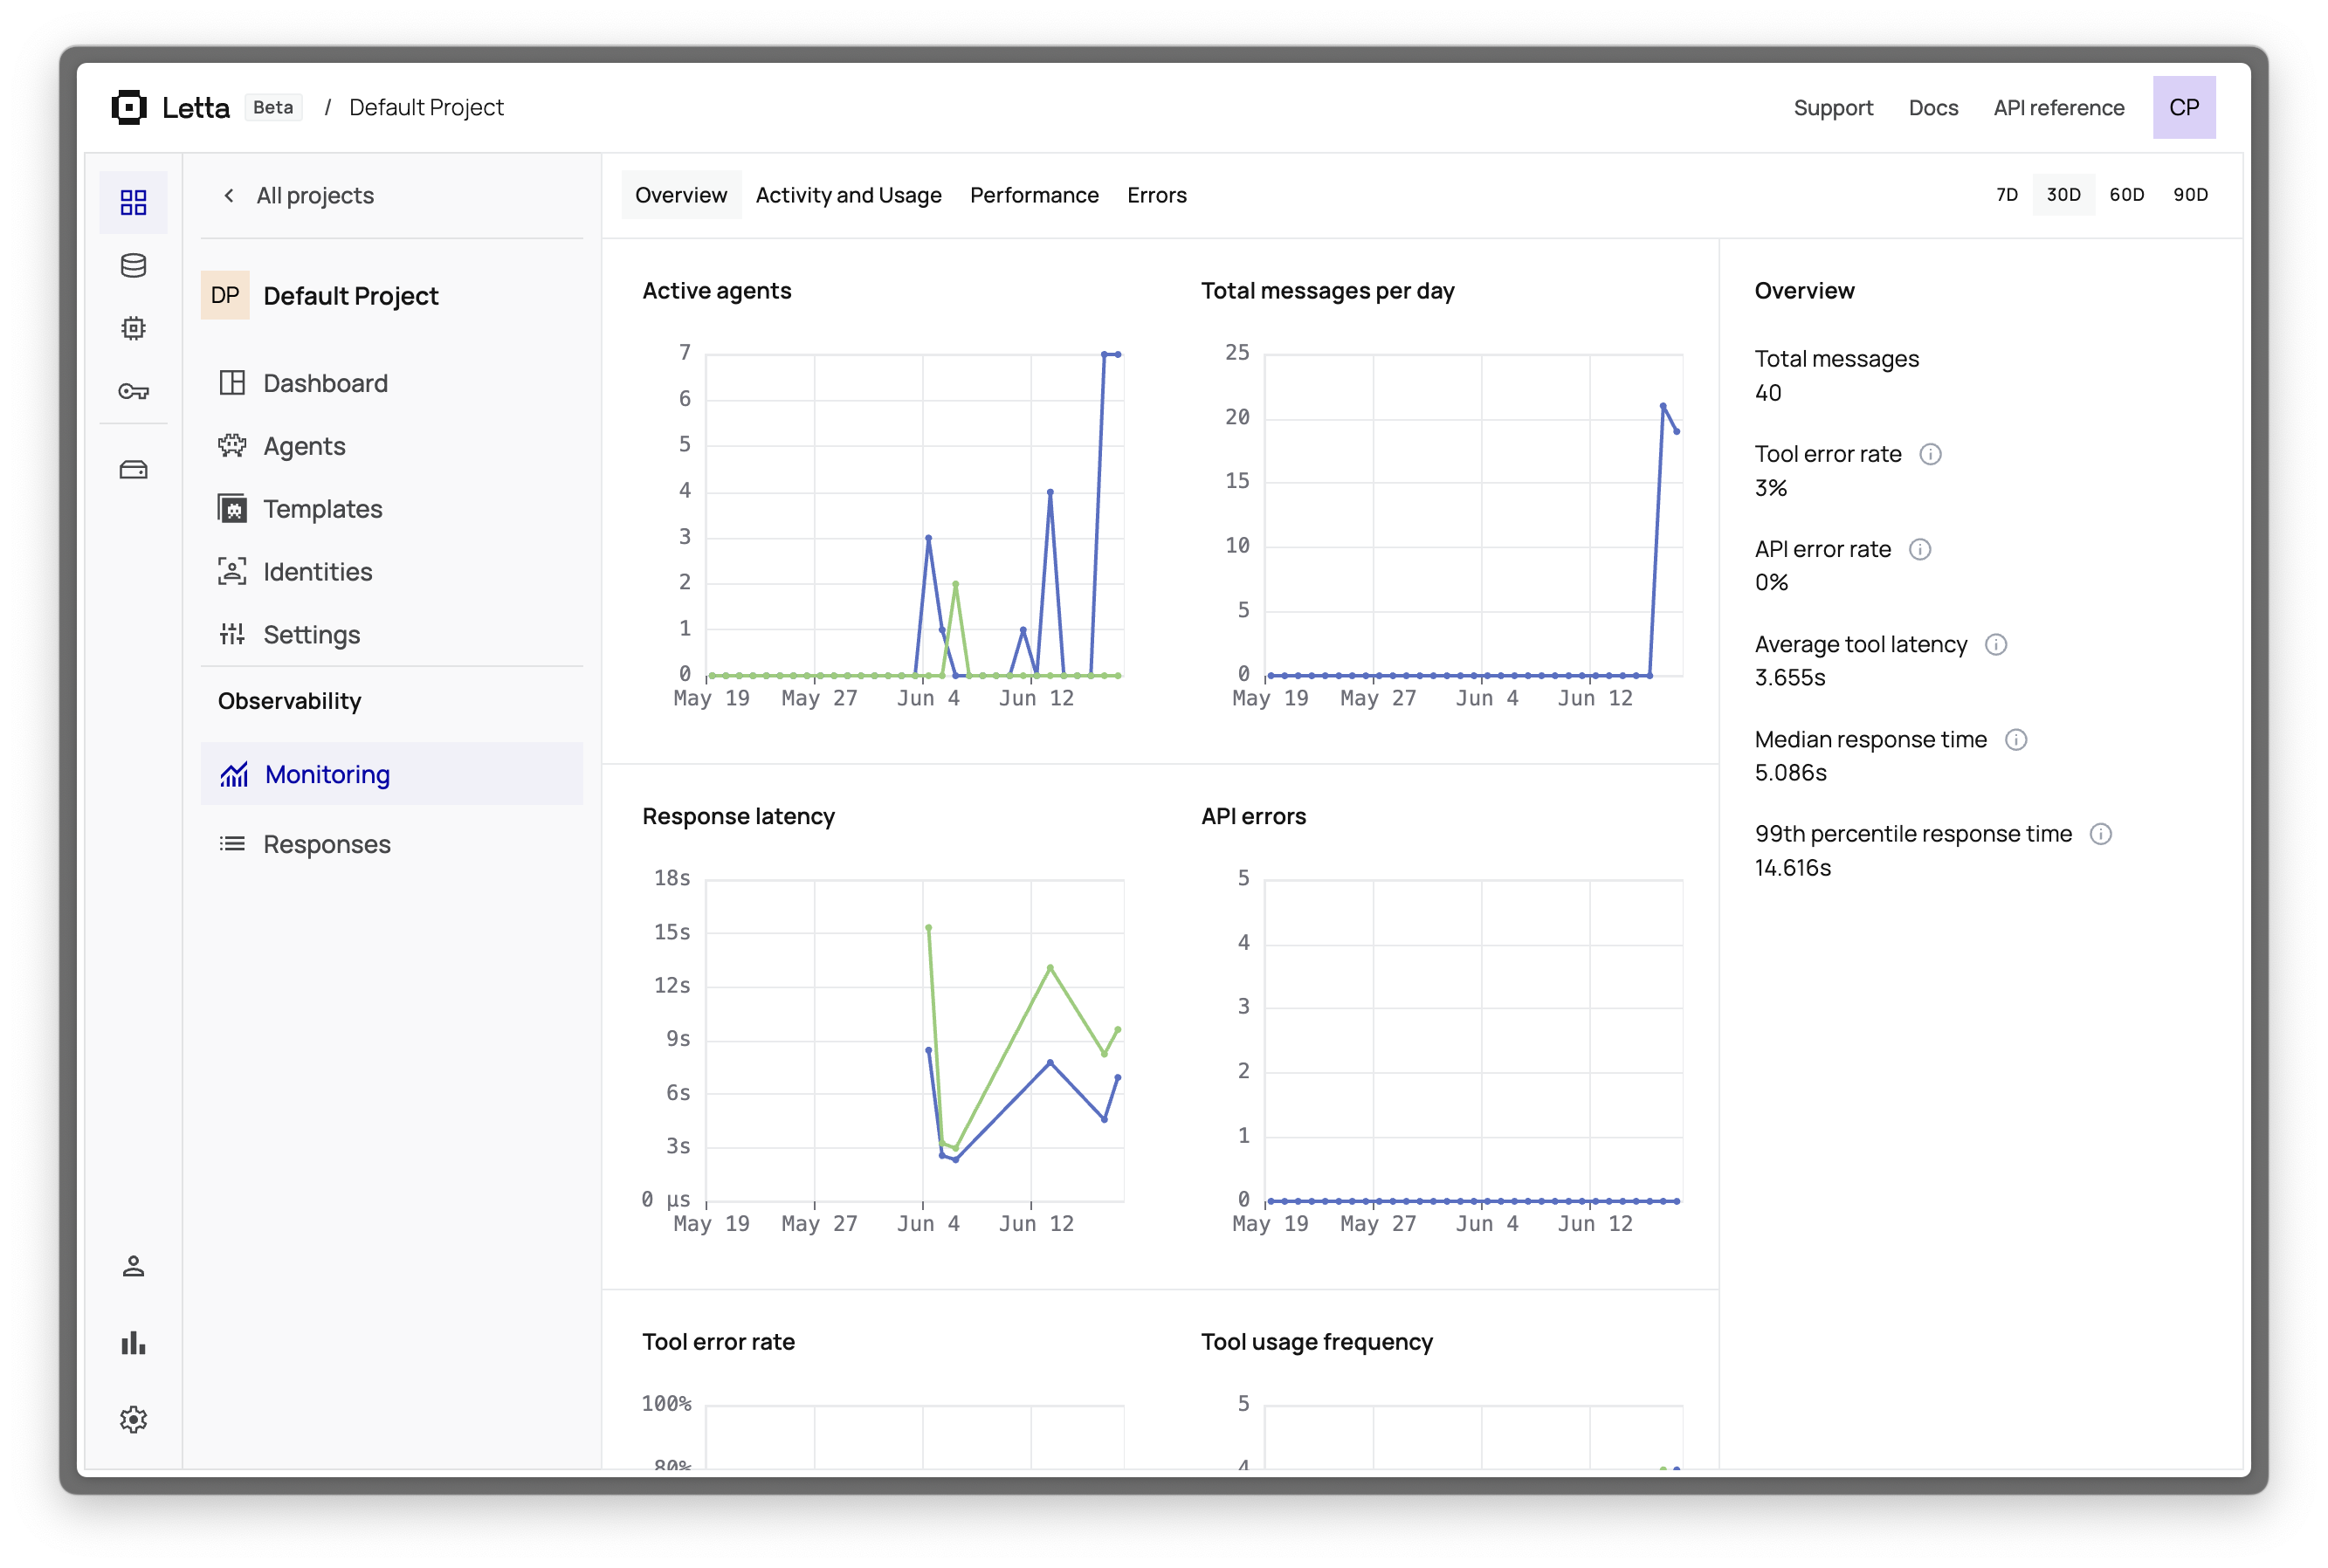
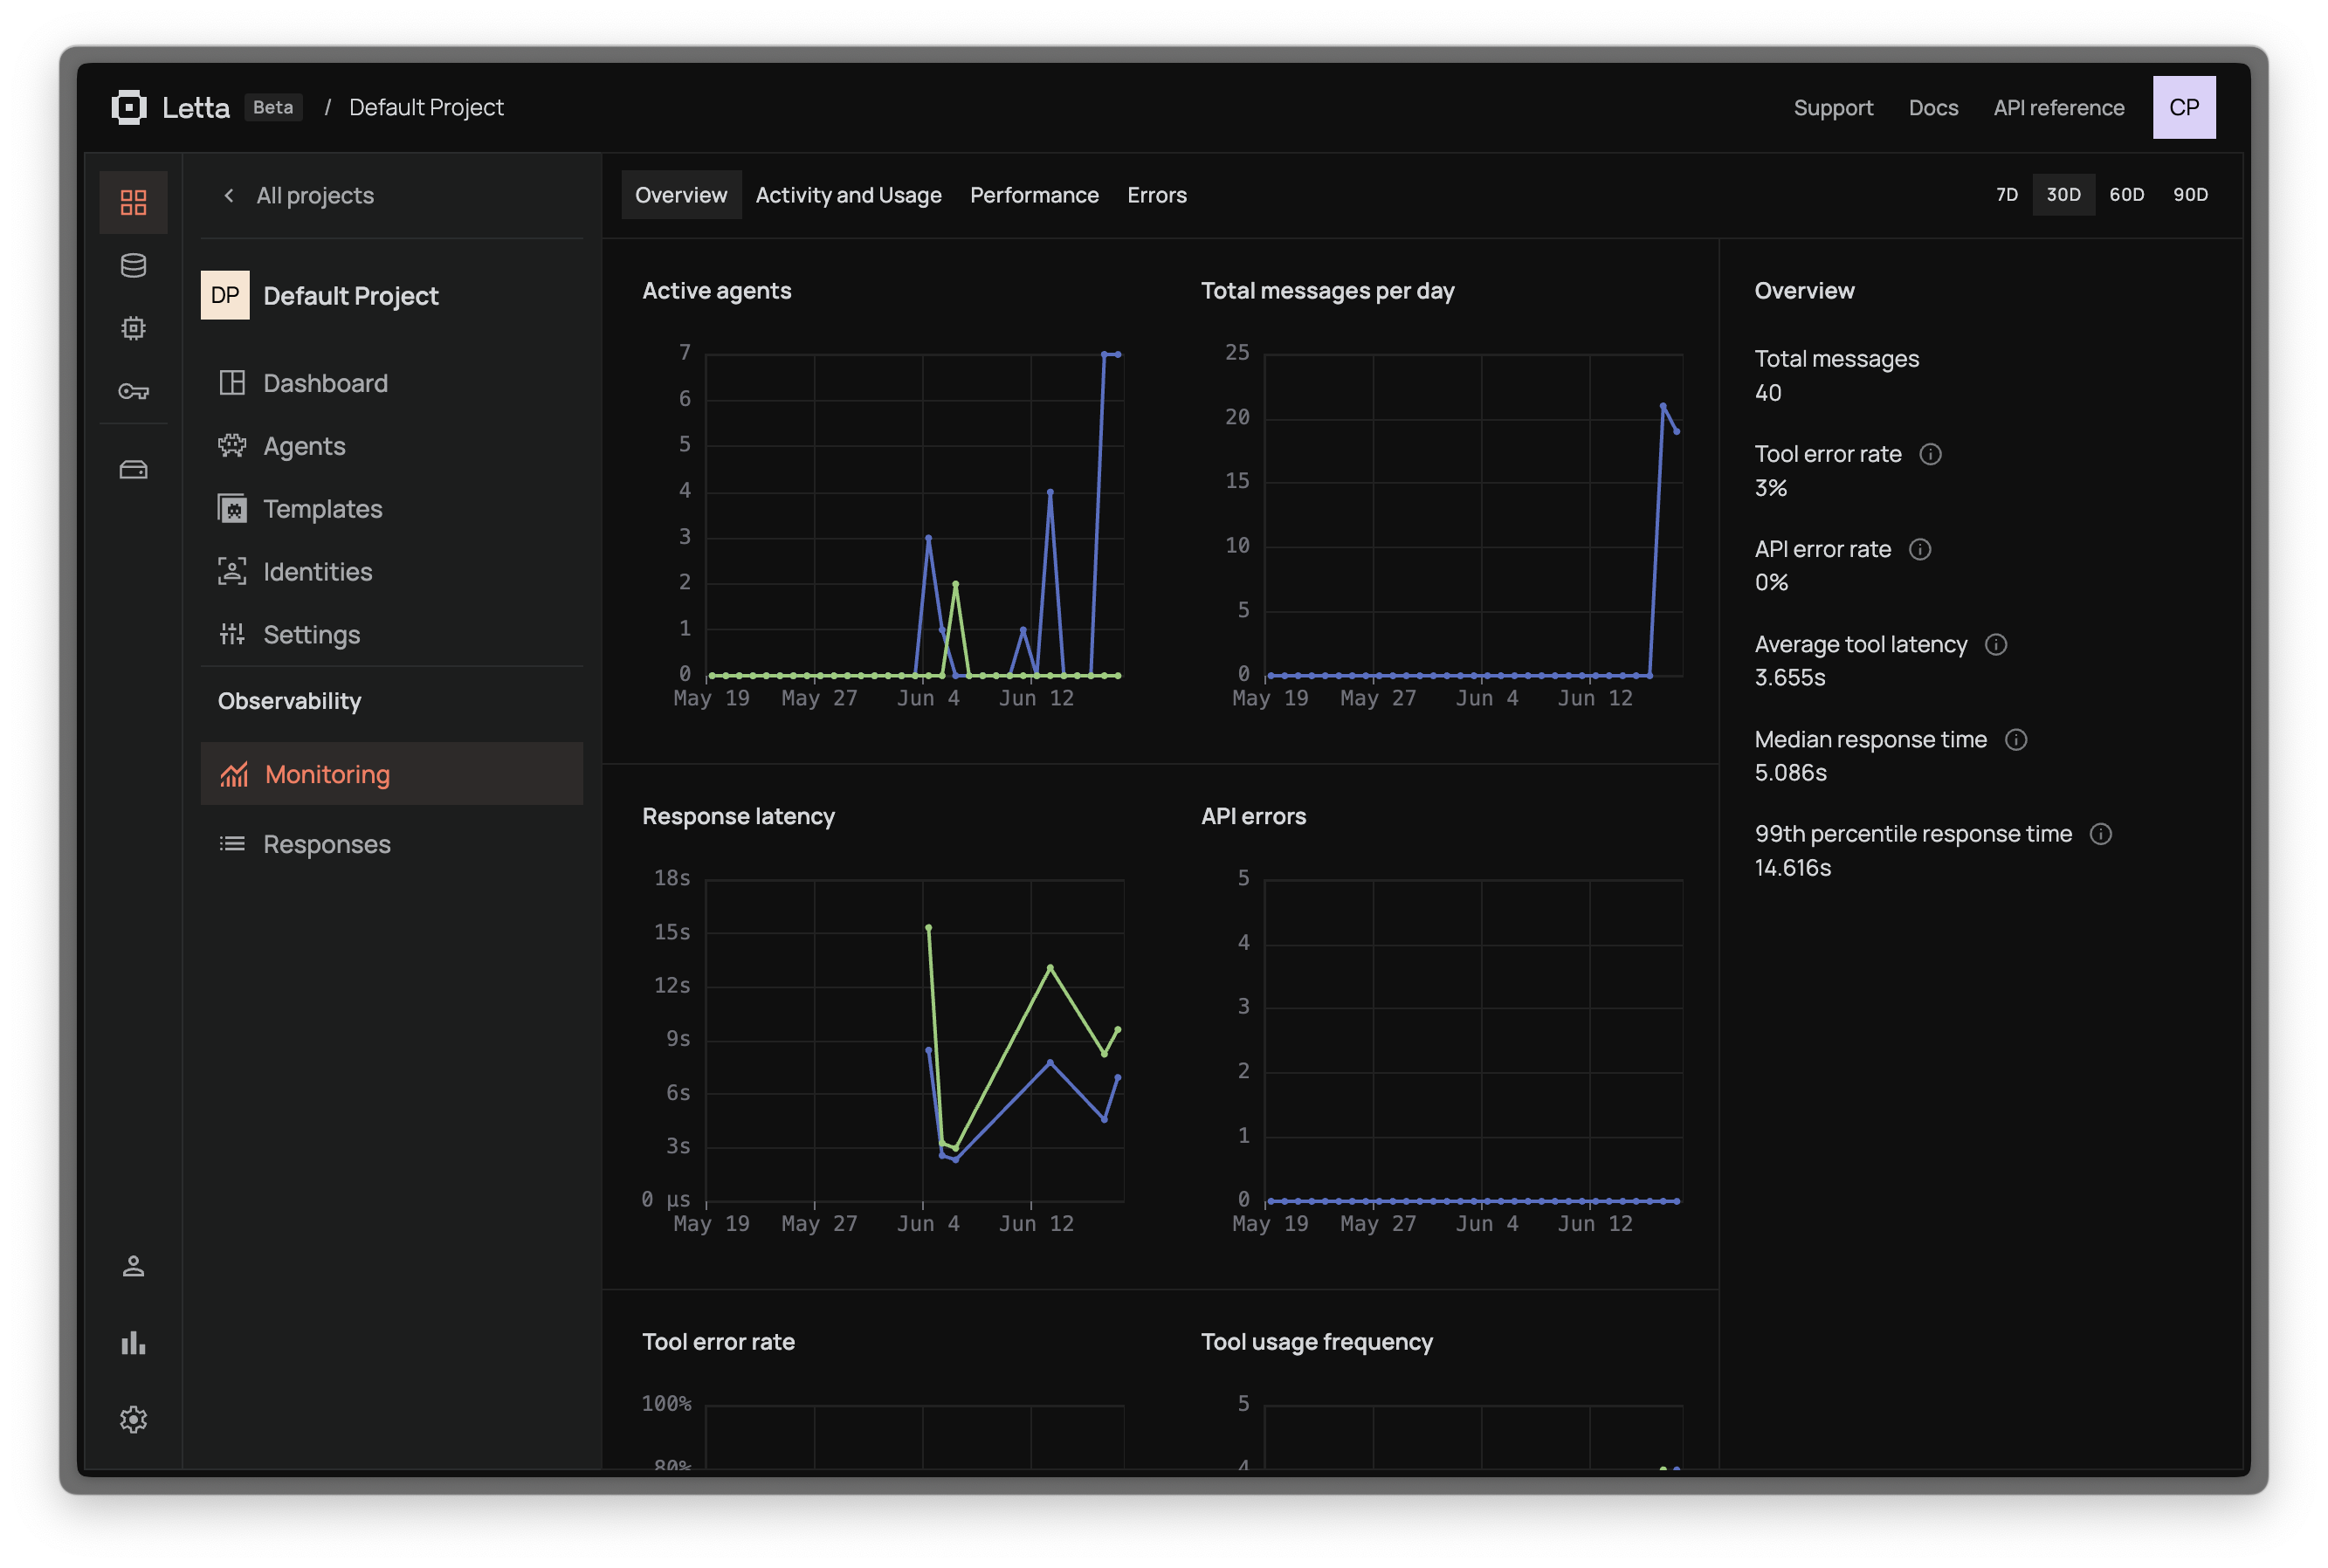
Overview
Section titled “ Overview”Get a high-level view of your agent’s health with essential metrics: total messages sent, API and tool error counts, plus LLM and tool latency averages. This dashboard gives you immediate visibility into system performance and reliability.
Activity & Usage
Section titled “ Activity & Usage”Track usage patterns including request frequency and peak traffic times. Monitor token consumption for cost optimization and see which features are used most. View breakdown by user/application to understand demand patterns.
Performance
Section titled “ Performance”Analyze response times with percentiles (average, median, 95th) broken down by model type. Monitor individual tool execution times, especially for external API calls. Track overall throughput (messages/second) and success rates to identify bottlenecks.
Errors
Section titled “ Errors”Categorize errors between API failures (LLM error, rate limits) and tool failures (timeouts, external APIs). View error frequency trends over time with detailed stack traces and request context for debugging. See how errors impact overall system performance.